15 Metro: The Statistical City
This folder contains the beginnings of the 15 Metro webapp.
15 Metro: The Statistical City is a webapp that gives insight into metropolitan areas in the United Sates and how they compare.
It uses census data to give a statistical summary of the 15 largest metropolitan areas in the United States (according to Wikipedia). This project explores similarities and differences in big cities around the United States, and is a way of interactively exploring a large, multivariate dataset.
This is a big data project that draws together a litany of tools for data ingestion, analysis, output, and visualization.
The data ingestion uses Python to send requests to a RESTful API from the Census Reporter to obtain geographic US Census data.
This information is stored in a MongoDB backend running alongside a Python Flask webserver that provides a RESTful interface to the MongoDB database.
Exploratory analysis of the data is performed with Pandas, Numpy, Scipy, StatModel, Seaborn, and Matplotlib, all Python libraries.
The analyzed data is then stored in the MongoDB instance, and is accessible via the RESTful API. The frontend of the webapp uses D3.js, Leaflet.js, and Angular.js to visualize the resulting (extremely high-dimensional and spatial) dataset.
metro: Python Package
The metro package provides objects for interfacing with the mongodb database. It wraps MongoDB into Pandas, using a generic Python-MongoDB class called Mogo, and a 15metro-specific implementation of a Mogo called a MetroMogo. This allows code like this:
mogo = mt.MetroMogo()
df = mogo.get_df(city,tablecode="B13016")
Here, the city code and the table code (B13016) are used to run a mongodb query, and the results are pushed into a Pandas dataframe. This dataframe is then returned.
This dataframe contains the raw data from the Census Reporter API, which is not particularly interesting. This data can be further processed, and derived quantities calculated and added to the dataframe, using custom classes. This allows code like this:
df2 = Table13016(df)
where df is the raw data from the
mongodb query, and df2 is a dataframe
containing computed, derived quantities.
(The function Table13016 must then be defined and imported).
15metro.github.io: Pelican Page
Site Layout
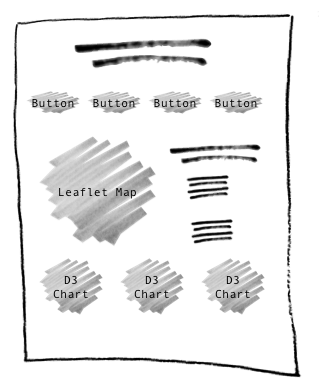
The site will consist of a couple of navigation layers, indicated by the buttons at the top of the page. By clicking different buttons, you'll get a different map overlay and D3 charts of different quantities.
There will be D3 charts and a leaflet map for each metropolitan area.
Topics
The topics buttons will include:
- Gender
- Age
- Income
- Housing density/availability/cost
- Mortgages
- Poverty status
- Education levels
- Industries
